Blogs
Category
Classify: 机器人学 Kinematics / 感知 Sense / 规划 Plan / 控制 Control / 嵌入式 Embedded /
Tags: Notes / Plans / Casual / Undefined /
Series
TO BE RELEASED
Contents
Bayes Filter
We can use such a graph to understand the meaning of Bayes Filter. For a certain moment \(t\), we apply a control \(u_t\) to the system, drive the system's state from \(x_{t-1}\) to \(x_t\). And at this particular moment, we can only obtain the measurement \(z_t\) rather than directly get \(x_t\). So attemp to estimate the state of the system for given input and measurement is the purpose of Bayes Filter.
graph LR
    L("x(0)") --> J(...)
    J--> B
    A("u(t-1)") --> B("x(t-1)")
    B --> C("z(t-1)")
    B --> E
    D("u(t)") --> E("x(t)")
    E --> F("z(t)")
    E --> H
    G("u(t+1)") --> H("x(t+1)")
    H --> I("z(t+1)")
H --> K(...)Cubic Spline 三次样条曲线
System Model
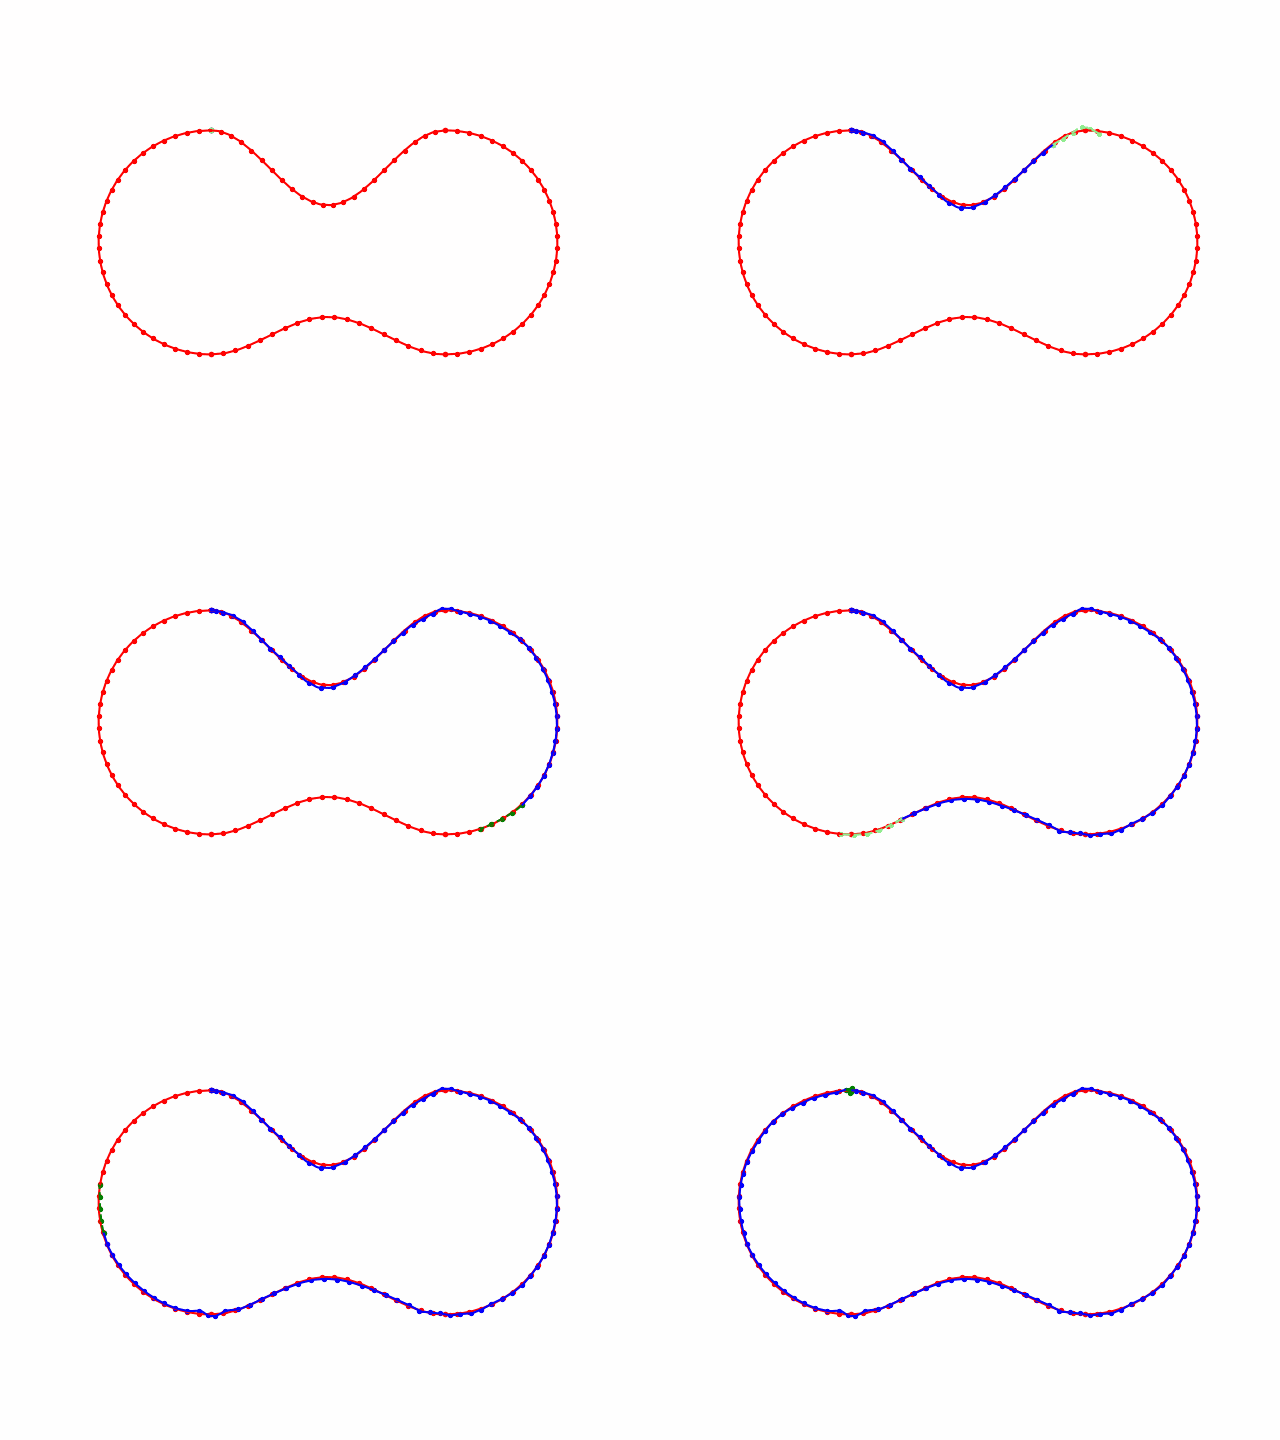
For a group of certain points \((x_{0,1},x_{0,2},\cdots,x_{0,m}),(x_{1,1},x_{1,2},\cdots,x_{1,m}), (x_{2,1},x_{2,2},\cdots,x_{2,m}), \cdots, (x_{n,1},x_{n,2},\cdots,x_{n,m})\), we want to find a smooth enough curve that passes all these points to achieve the interpolation goal. To do so, we can use piecewise cubic functions to fitting the points.


